

Capacity Estimation
Capacity estimation is the back-of-the-envelope math that turns "design Twitter" into concrete numbers: 200M DAU × 50 reads/day = 10B reads/day ≈ 115k QPS average, 5-10x peak. You estimate QPS, storage, bandwidth, and cache size from user counts and behavior, then size each system component accordingly. The math is approximate (order-of-magnitude is the goal), but it is the single most distinguishing skill in system design interviews — it separates hand-waving from engineering.
How it works
Capacity estimation is the practice of computing approximate values for QPS, storage, bandwidth, and cache size from a small set of inputs: number of users, daily activity per user, read/write ratio, payload sizes, retention period. The goal is not precision — it is order-of-magnitude correctness, enough to drive architecture decisions.
In a system design interview, capacity estimation typically follows the high-level design and precedes the deep-dive. After you sketch the boxes and arrows, you compute the numbers and use them to decide: "at 100k QPS we need a load balancer + 20 app servers + a 3-node Redis cluster + a sharded PostgreSQL." Without these numbers, the design is unbounded; with them, you can defend every component choice.
The discipline has three core skills:
- Unit awareness. Know that 1 GB = 10^9 bytes, 1 GiB = 2^30 bytes, 1 Gbps = 10^9 bits/sec = 125 MB/sec. Mixing these up is the most common mistake.
- Reasonable assumptions. You will not be given every number; you must assume. State assumptions explicitly: "assume 200M DAU, 50 reads/user/day, 1 KB average payload."
- Back-of-the-envelope arithmetic. Round aggressively. 200M × 50 = 10B ≈ 10^10 reads/day. 10B / 86400 sec ≈ 115k QPS average. Peak 3-5x average = 350-575k peak QPS. Done in 30 seconds.
The four sub-estimations cover the system end-to-end:
- QPS — how many requests per second, split read vs write.
- Storage — how much disk over time (with retention).
- Bandwidth — how much network egress per second.
- Cache size — how big the hot set is, in RAM.
Each is covered in its own dedicated concept; this concept ties them together as a single interview exercise.
Units — the source of all estimation mistakes.
Capacity estimation has one recurring bug: unit confusion. Memorize these conversions before any interview:
Storage:
- 1 KB = 10^3 bytes (kilobyte, decimal)
- 1 KiB = 2^10 bytes = 1024 bytes (kibibyte, binary)
- 1 MB = 10^6 bytes, 1 MiB = 2^20 ≈ 1.05 MB
- 1 GB = 10^9 bytes, 1 GiB = 2^30 ≈ 1.07 GB
- 1 TB = 10^12 bytes, 1 TiB = 2^40 ≈ 1.10 TB
- 1 PB = 10^15 bytes
For estimation, treat 1 KB ≈ 10^3 and 1 KiB ≈ 10^3 — close enough.
Network / throughput:
- 1 Gbps = 10^9 bits/sec = 125 MB/sec (note: bits, not bytes — 8 bits per byte)
- 1 GB/sec = 8 Gbps
- A 1 Gbps network connection can transfer ~125 MB/sec.
Time:
- 1 day = 86,400 seconds ≈ 100,000 seconds (round up by 15% for estimation)
- 1 year = 365 days ≈ 31.5 million seconds
Requests:
- 1 million requests/day ≈ 11.6 requests/sec (divide by 86,400)
- 1 billion requests/day ≈ 11,600 requests/sec
The most common interview mistake: confusing bits and bytes for bandwidth. "1 Gbps" is gigabits per second, not gigabytes. A 1 Gbps network transfers ~125 MB/sec, not 1 GB/sec. Get this wrong and your bandwidth estimates are off by 8x.
The second most common mistake: forgetting to convert daily to per-second. "1 billion reads/day" is not "1 billion QPS" — it is ~11,600 QPS. The conversion is divide by 86,400 (or ~100,000 for rough estimation).
Traffic is never uniform. Peak QPS is typically 2-5x average for normal workloads, and 10-100x for event-driven spikes (Super Bowl, Black Friday, breaking news). If you size for average, you will fail at peak. The standard approach: estimate average, multiply by 3-5x for peak (normal), and reserve headroom above that (design for 2x peak). So if average is 100k QPS, design for 500k-1M QPS. This is why interviewers love follow-ups like "what if a tweet goes viral" — they want to see peak thinking, not just average.
Using the numbers — driving architecture decisions.
The point of capacity estimation is not the numbers themselves; it is the architecture decisions they drive. After computing QPS, storage, bandwidth, and cache size, you translate each into a system design decision:
- QPS > 1k: Load balancer + multiple app instances (single server cannot keep up).
- QPS > 100k: Add caching aggressively; a single Redis may not suffice (cluster).
- Read:Write ratio > 10:1: Cache-friendly design; cache-aside or write-through.
- Storage > 1 TB: Plan for backup/restore times, IOPS, and possibly sharding.
- Storage > 10 TB (media): Use object storage (S3), not a database.
- Bandwidth > 1 Gbps: CDN mandatory for static/media content.
- Hot set < available RAM: Cache fits in one Redis; simple architecture.
- Hot set > 10 GB: Redis cluster or sharded cache.
- Write QPS > 10k: Database write scaling (sharding, federation) becomes necessary.
The exercise also reveals non-obvious bottlenecks. In the Twitter example, the bandwidth estimate (92 Gbps for media) dwarfs everything else — this immediately tells you that the CDN is the most critical component, not the database or the cache. Without capacity estimation, you might spend the interview discussing database sharding when the real bottleneck is media egress.
This is the deeper skill: capacity estimation surfaces the bottleneck that drives the entire design. The component with the largest number is the component the design must optimize for.
How to do capacity estimation in an interview (30 seconds to 2 minutes).
-
State your inputs and assumptions explicitly. "Assume 200M DAU, 5 tweets/user/day, 50 reads/user/day, 500 B per tweet, 5-year retention." The interviewer can correct any of these; you do not have to be right, just explicit.
-
Compute QPS first. Reads/day ÷ 86400 = average read QPS. Writes/day ÷ 86400 = average write QPS. Multiply by 3-5x for peak.
-
Compute storage. Per-day storage × 365 × retention years = total storage. Don't forget replicas (×3) and indexes (~30% overhead).
-
Compute bandwidth. Average QPS × payload size = average bandwidth. Multiply by peak factor.
-
Compute cache size. Estimate the hot set: 1% of users generating 50% of reads is a common assumption. Cache = hot set size.
-
Translate each number into a design decision. "At 500k peak QPS, we need a load balancer + 50 app servers + a 3-node Redis cluster + a CDN for static."
-
Call out the dominant constraint. "Bandwidth is 92 Gbps, so the CDN is the most critical component. Database sharding matters less."
The goal is not precision — interviewers know your numbers are approximate. The goal is to demonstrate that you can reason about scale and connect numbers to architecture. A candidate who does this in 2 minutes stands out from one who waves hands for 30 minutes.
You estimate a system at 200M DAU, 50 reads/user/day, average payload 1 KB. What is the average read bandwidth in Gbps?
Pick one answer.
Why does the standard interview practice include "multiply average QPS by 3-5x for peak"?
Pick one answer.
After computing capacity estimates, you find that bandwidth is 92 Gbps but database write QPS is only 11k. What does this tell you about the system's primary constraint, and how should you prioritize design effort?
Pick one answer.
Engineering mental model
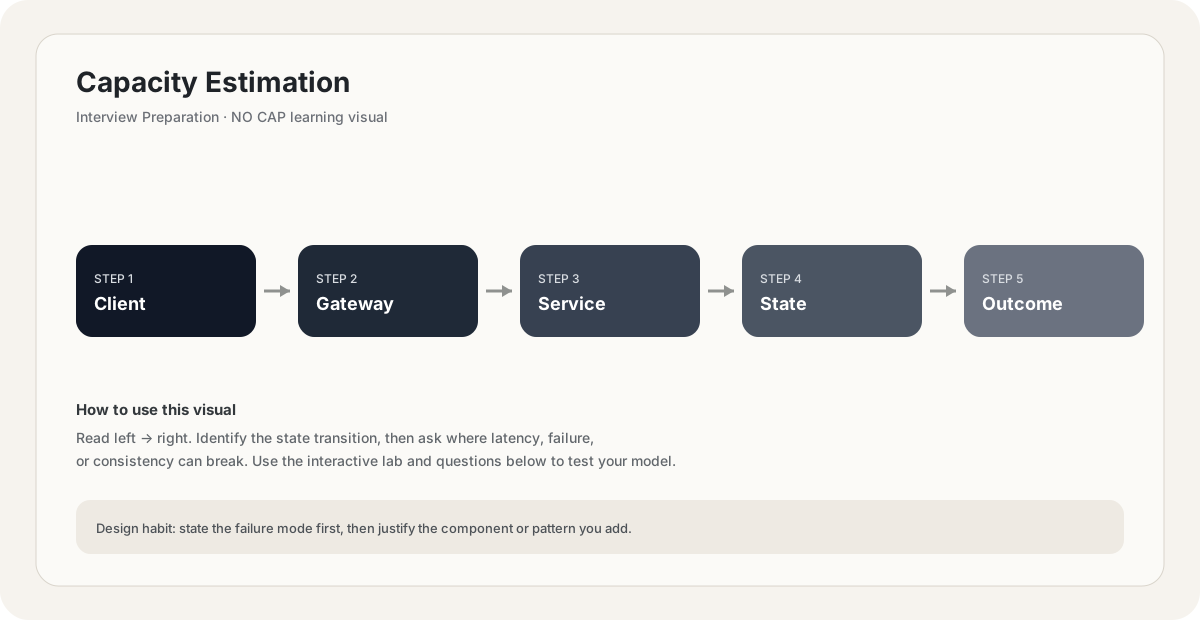
Mental model. Think of Capacity Estimation as a deliberate boundary in a system. The boundary exists because something becomes harder to manage when everything is done in one place: latency, scale, failure isolation, consistency, cost, or team ownership. The useful question is not “what does Capacity Estimation mean?” but “what pressure makes this boundary worth introducing, and what new failure mode does it create?”
Before choosing Capacity Estimation, name the workload, the critical user path, the dominant bottleneck, the failure you are trying to absorb, and the trade-off you are willing to accept. If you cannot name those five things, the design is probably premature.
// Pseudocode
request = receive()
result = capacity_estimation(request)
return result

// Production questions:
// 1. What happens on timeout?
// 2. Can this operation be retried safely?
// 3. What is the bottleneck?Back-of-the-envelope reasoning
Example: 10M requests/day ÷ 86,400 ≈ 116 requests/s average. Design for peak rather than average; a 10× peak is ≈ 1,160 requests/s.
Interactive sandbox: Capacity Estimation
Capacity estimation translates users to QPS and bandwidth. Predict peak load for Capacity Estimation.
Change one variable at a time. Predict the failure mode first, then move the slider and see whether your mental model matches the simplified system response.
If you are stuck on Capacity Estimation, start by drawing the request path and marking every network hop, stateful component, queue, cache and failure boundary. Then estimate where the system will saturate.
You increase traffic by 10× in a system using Capacity Estimation. What should you inspect first?
Pick one answer.
Which statement is the safest engineering habit when using Capacity Estimation?
Pick one answer.
You have dashboards for traffic, latency, errors and saturation. You can change the architecture, but every change has operational cost.
Production scenario: your system uses Capacity Estimation, traffic suddenly spikes, and p99 latency doubles. What is your first move?
Interview drill
Answer this without notes: When would you choose Capacity Estimation, and when would you intentionally avoid it? Mention at least one bottleneck it addresses, one failure mode it introduces, and one alternative. Then quantify the workload you are designing for.
A useful engineering lens for Capacity Estimation: define the problem it solves, the simpler design that fails first, the constraint that forces you to introduce this concept, and the new failure modes the concept creates.
Numerical sanity check
Back-of-the-envelope reasoning beats fake precision. State your traffic, payload, concurrency and growth assumptions explicitly, then calculate enough to know whether the current architecture is orders of magnitude away from the target.
Do not optimize for a memorized definition. Reason from the workload and failure mode.
Imagine the simplest version of a system using Capacity Estimation. What breaks first as traffic grows by 10×, and what would you change before reaching 100×?
Pick one answer.
What you gain, what you pay
- +Turns abstract design into concrete numbers that drive architecture.
- +Identifies the dominant constraint (the bottleneck that drives the design).
- +Surfaces non-obvious bottlenecks (e.g., media bandwidth dwarfing database load).
- +Enables cost estimation — instances, storage, bandwidth all cost money.
- +Standardized methodology works across any system (Twitter, YouTube, Uber, ...).
- −Numbers are approximate — order-of-magnitude only; do not over-index on precision.
- −Assumptions can be wrong — state them explicitly so the interviewer can correct.
- −Easy to confuse units (bits vs bytes, KB vs KiB) — memorize conversions.
- −Captures steady-state, not failure modes (cache crash, network partition).
- −Does not capture latency — QPS says nothing about per-request latency without further analysis.
How this breaks in production
- Unit confusion — bits vs bytes (8x error), KB vs KiB (small but compounds).
- Forgetting to convert daily to per-second (86400x error).
- Sizing for average instead of peak — system fails at peak.
- Mistaking the dominant constraint — spending design effort on the wrong bottleneck.
- Forgetting replicas and indexes in storage estimates (off by 3-4x).
- Treating estimates as exact — building infrastructure "for 115k QPS" when 100k-130k is the actual range.
Don't fall into these traps
- •Not stating assumptions explicitly — interviewer cannot correct silent wrong assumptions.
- •Confusing bits and bytes for bandwidth.
- •Forgetting the peak factor (3-5x average).
- •Spending design effort on the wrong bottleneck after computing numbers.
- •Not translating numbers into architecture decisions — numbers without design are useless.
- •Trying to be too precise — round aggressively; order-of-magnitude is the goal.
Real systems using this
How real systems implement this
- Twitter / X scale estimates — Public engineering estimates: ~500M DAU, ~6,000 tweets/sec average, ~8,000+ peak (events), ~300k QPS for timeline reads. Storage dominated by media. These are the canonical numbers interviewers reference.
- WhatsApp scale estimates — WhatsApp at 1B users handled ~50B messages/day with ~50 engineers. Their architecture was driven by capacity estimation: 1B × 50 = 50B/day ≈ 580k QPS, served by Erlang on vertically scaled machines.
- AWS / cloud capacity planning — Cloud cost estimation tools (AWS Calculator, Cloudflare pricing) all reduce to the same four estimations: QPS (request pricing), storage (GB-month), bandwidth (GB egress), cache size (RAM-hour). The same math, applied to billing.
- Netflix Open Connect capacity planning — Netflix sizes Open Connect Appliances (OCAs) at ISP points-of-presence based on estimated peak bandwidth per region. Their capacity planning is bandwidth-first, exactly the dominant-constraint methodology.
Practice saying it out loud
- Q1Estimate the QPS, storage, and bandwidth for Twitter with 200M DAU.
- Q2Estimate the storage required for YouTube for 5 years of video retention.
- Q3Your system has 100k average QPS. What peak QPS do you design for, and why?
- Q4After computing capacity estimates, you find bandwidth is 10x the database load. How does this change your design?
- Q5Estimate the cache size needed for a news feed with 100M DAU and an 80/20 access pattern.
Further reading & references
Core explanations are original NO CAP material. External references are provided for deeper study and standards.
What next?
Mark as understood once the mental model clicks.
Next recommended
QPS Estimation