

Alerts & Visualization
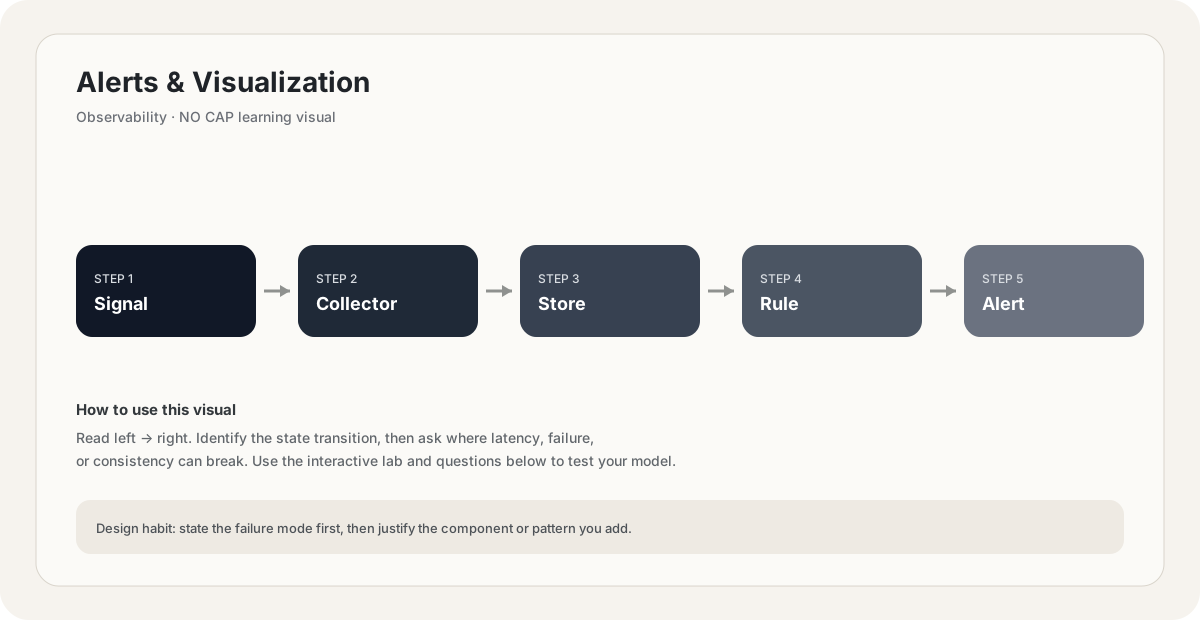
Alerts and visualization are the user-facing layer of observability: dashboards make the system's state visible at a glance, and alerts notify humans when something needs attention. Good alerting is hard — alert on too much and on-call engineers burn out from fatigue (alert deafness); alert on too little and outages go undetected. The rule: every alert must be actionable, investigated, and either fixable or silenced.
Foundational.
How it works
Alerts and visualization are two sides of the same coin: dashboards show the system's state continuously; alerts pull humans in when the state needs attention. Both are essential — and both are easy to get wrong.
Dashboards answer: "what's the system doing right now?" They should be designed for a quick glance: at-a-glance health (red/green), with the ability to drill into details. A good dashboard has 4-6 panels, organized by service, with the most important metrics (the four golden signals) at the top.
Alerts answer: "does a human need to look at this right now?" They should be rare, actionable, and attached to a runbook. An alert that fires frequently without action is alert fatigue — a leading cause of burnout and prolonged outages.
Good dashboards follow a few principles:
- Glanceable: a quick look tells you if the system is healthy. Use color (red/green/yellow) and clear thresholds. If you have to read numbers, it's not glanceable.
- Layered: top-level overview dashboard shows service health. Clicking through gets per-service dashboards with details.
- Service-centric: one dashboard per service, showing its golden signals (latency, traffic, errors, saturation).
- SLO-aware: include the SLO and error budget burn rate on the dashboard, so the team knows where they stand.
- Time-aware: default to last 1 hour, with the ability to zoom out to 24h or 7d for trends.
- Don't overcrowd: 4-6 panels per dashboard. More than that and the eye can't find what's important.
Grafana is the de-facto open-source tool. Datadog, New Relic, Splunk are commercial equivalents. The tool matters less than the design — a well-designed dashboard in any tool beats a poorly designed one in the "best" tool.
Designing alerts that don't suck:
- Alert on SLO burn rates, not raw thresholds. "p99 > 1s" fires constantly due to variance. "SLO burn rate of 14x over 1 hour" fires when there's a real problem worth paging for. This is the Google SRE multi-window multi-burn-rate approach.
- Use multiple windows: short window (5min, high burn rate) for acute outages; long window (1h or 6h, lower burn rate) for chronic problems. Page on the short window, ticket on the long window.
- Every page needs a runbook. The page should link to the runbook for that alert — what to check, what to do, who to escalate to. Without a runbook, the on-call engineer is debugging from zero.
- Symptom-based over cause-based. Don't alert on "CPU > 90%" (a cause) — alert on "user-facing latency exceeds SLO" (a symptom). The user doesn't care about CPU; they care about latency. Symptom alerts catch problems regardless of cause.
- Eliminate flapping. Alerts that fire and clear repeatedly train the team to ignore them. Add hysteresis (alert at 90%, clear at 80%) and minimum duration (alert only after 5 minutes).
Alerting only works if there's a human to receive it. A 24/7 on-call rotation with primary + secondary is the standard. Key principles: rotations of 1 week, not 2 (avoid burnout); follow-the-sun for global teams (no one gets woken up at 3am unless it's their daytime); secondary on-call handles escalations; post-on-call debriefs identify which alerts were noise and should be silenced. The team that builds the system runs the system — this creates feedback: noisy alerts get fixed because they affect the people who can fix them.
Alert fatigue is the silent killer of SRE teams. Symptoms:
- On-call gets >10 pages per day.
- Pages are routinely ignored or auto-dismissed.
- The team has learned to wait for the second or third page before investigating.
- Mean time to acknowledge (MTTA) is growing.
- Engineers dread the on-call rotation.
Fixes:
- Audit every alert. Was it actionable? If not, silence or convert to a ticket.
- Eliminate redundant alerts. If three alerts fire for the same underlying issue, keep one.
- Add hysteresis. Many flaps are because the metric crosses a threshold briefly. Add minimum duration and clear thresholds.
- Move chronic issues to tickets. Slow SLO burn over 6 hours is a problem but not a 3am page.
- Track alert metrics. Pages per shift, % actionable, MTTA, MTTR. If pages per shift is rising, fix it before burnout.
A team that gets 2-3 actionable pages per shift responds in 5 minutes. A team that gets 50 pages per shift responds in 30. Less is more.
Your team gets 40 pages per day. Most are auto-dismissed. The last three outages took 30+ minutes to acknowledge. What's the diagnosis and the fix?
Pick one answer.
Which alert is best designed?
Pick one answer.
What's the difference between a page and a ticket?
Pick one answer.
Engineering mental model
Mental model. Think of Alerts & Visualization as a deliberate boundary in a system. The boundary exists because something becomes harder to manage when everything is done in one place: latency, scale, failure isolation, consistency, cost, or team ownership. The useful question is not “what does Alerts & Visualization mean?” but “what pressure makes this boundary worth introducing, and what new failure mode does it create?”
Before choosing Alerts & Visualization, name the workload, the critical user path, the dominant bottleneck, the failure you are trying to absorb, and the trade-off you are willing to accept. If you cannot name those five things, the design is probably premature.
// Pseudocode
request = receive()
result = alerts_visualization(request)
return result

// Production questions:
// 1. What happens on timeout?
// 2. Can this operation be retried safely?
// 3. What is the bottleneck?Back-of-the-envelope reasoning
Numerical lens: write down traffic, payload size, read/write ratio, peak multiplier and durability target before choosing a component. The numbers should justify the architecture.
Interactive sandbox: Alerts & Visualization
Alert fatigue grows with noise. Predict on-call pages per shift for Alerts & Visualization.
Change one variable at a time. Predict the failure mode first, then move the slider and see whether your mental model matches the simplified system response.
If you are stuck on Alerts & Visualization, start by drawing the request path and marking every network hop, stateful component, queue, cache and failure boundary. Then estimate where the system will saturate.
You increase traffic by 10× in a system using Alerts & Visualization. What should you inspect first?
Pick one answer.
Which statement is the safest engineering habit when using Alerts & Visualization?
Pick one answer.
You have dashboards for traffic, latency, errors and saturation. You can change the architecture, but every change has operational cost.
Production scenario: your system uses Alerts & Visualization, traffic suddenly spikes, and p99 latency doubles. What is your first move?
Interview drill
Answer this without notes: When would you choose Alerts & Visualization, and when would you intentionally avoid it? Mention at least one bottleneck it addresses, one failure mode it introduces, and one alternative. Then quantify the workload you are designing for.
A useful engineering lens for Alerts & Visualization: define the problem it solves, the simpler design that fails first, the constraint that forces you to introduce this concept, and the new failure modes the concept creates.
Numerical sanity check
Back-of-the-envelope reasoning beats fake precision. State your traffic, payload, concurrency and growth assumptions explicitly, then calculate enough to know whether the current architecture is orders of magnitude away from the target.
Do not optimize for a memorized definition. Reason from the workload and failure mode.
Imagine the simplest version of a system using Alerts & Visualization. What breaks first as traffic grows by 10×, and what would you change before reaching 100×?
Pick one answer.
What you gain, what you pay
- +Dashboards give at-a-glance visibility into system health.
- +Good alerting catches real issues before users notice.
- +SLO-based alerting aligns alerts with business priorities.
- +Runbook-attached alerts reduce time-to-resolution.
- −Alert fatigue from too many non-actionable alerts.
- −Cause-based alerts (CPU, disk) fire without user impact.
- −Flapping alerts without hysteresis train teams to ignore them.
- −Dashboards nobody looks at are wasted engineering.
How this breaks in production
- Alert fatigue — too many non-actionable pages, team stops reading them.
- Flapping alerts without hysteresis fire and clear repeatedly.
- Cause-based alerts ("CPU high") that don't reflect user impact.
- Dashboards that show too many panels — eye can't find what's important.
Don't fall into these traps
- •Alerting on raw thresholds instead of SLO burn rates.
- •Alerting on causes (CPU, disk) instead of symptoms (latency, errors).
- •Not attaching runbooks to alerts — on-call debugs from zero.
- •Not auditing alerts — once-added alerts persist forever, even if useless.
Real systems using this
How real systems implement this
- PagerDuty + Grafana + Prometheus — Open-source stack: Grafana for dashboards, Prometheus for alerting rules, Alertmanager for routing, PagerDuty for paging and on-call rotation. Industry standard.
- Google SRE Multi-window Multi-burn-rate — Alerting strategy that pages on high SLO burn over short windows (acute outages) and tickets on lower burn over long windows (chronic problems). Dramatically reduces alert fatigue.
Practice saying it out loud
- Q1What is alert fatigue, and how do you prevent it?
- Q2Why alert on SLO burn rates instead of raw thresholds?
- Q3What's the difference between a page and a ticket? Give an example of each.
- Q4What makes a good dashboard?
Further reading & references
Core explanations are original NO CAP material. External references are provided for deeper study and standards.
What next?
Mark as understood once the mental model clicks.
Next recommended
SLO / SLA / SLI