

Availability Monitoring
Availability monitoring measures whether users can actually reach and use your service — from outside the data center, not just from inside. It uses synthetic probes (Periodic HTTP requests from global locations) to detect outages that internal health checks miss: DNS failures, load balancer misconfigurations, region routing issues, TLS expiry. The output is uptime (e.g., 99.95% over 30 days) and the alerting is paged when availability drops below the SLO.
Foundational.
How it works
Availability monitoring answers a simple question: "can a user, somewhere on the internet, reach my service right now?" It's the most fundamental metric — and one that's surprisingly easy to get wrong, because internal checks can all be green while the service is unreachable.
The technique is synthetic monitoring: a service (Pingdom, UptimeRobot, Datadog Synthetics, Catchpoint) makes periodic HTTP requests to your endpoint from multiple geographic locations, simulating a real user. If the request fails or is too slow, it counts against availability. The probes run every 1-5 minutes from ~10 global locations.
Availability is reported as a percentage over a window (e.g., 99.95% over 30 days). 99.95% means about 22 minutes of downtime per month — the SLA target for many cloud services.
What endpoints should synthetic probes check? The principle is to monitor the user-visible critical paths:
- Homepage / login page: is the most-visited page reachable? Is the TLS cert valid?
- Login flow: can users actually log in? (A simple GET isn't enough — you need a scripted probe that submits credentials and checks the response.)
- Critical API endpoint: e.g., GET /api/v1/health on the public API.
- A representative business action: e.g., "add an item to cart" — confirms the whole stack works end-to-end.
For each, set thresholds: response must be 200 within 2 seconds from each region. Slower or non-200 responses count as downtime.
Don't monitor only the load balancer's health check endpoint — that confirms the LB is up, not that users can reach it. Probe the real URL.
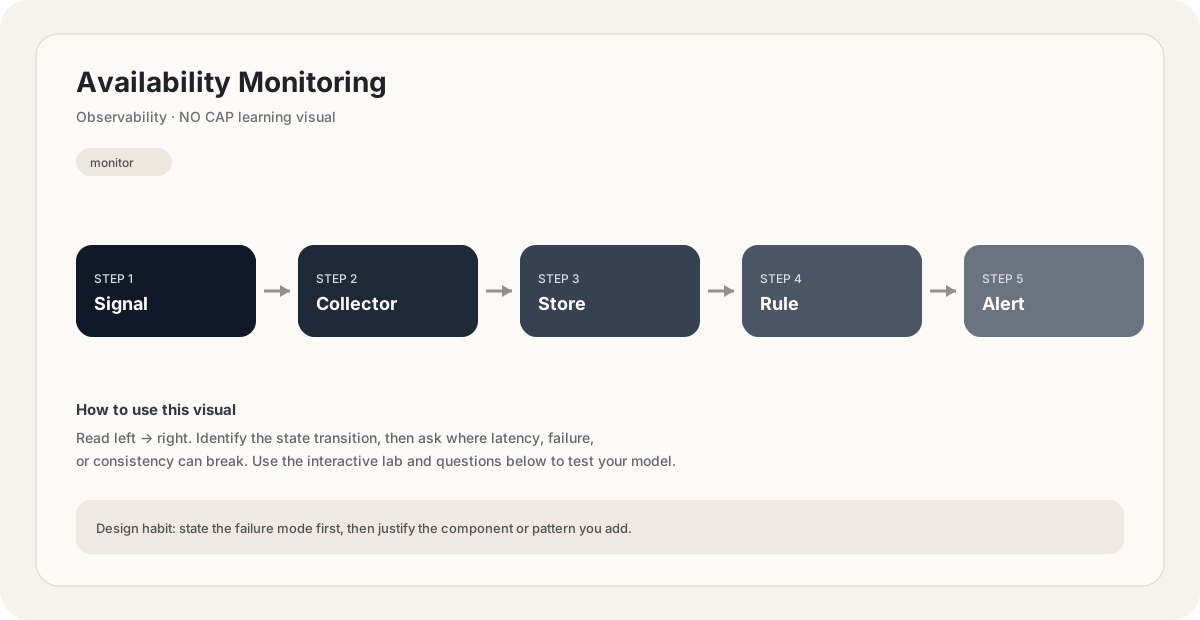
Availability monitoring drives alerting. The standard pattern:
- Single probe failure: don't page. Probes flake, networks are lossy, single-region outages happen. Wait.
- Multiple regions failing for >1 minute: page. This is real.
- Sustained failures affecting SLO: page. If availability drops below the SLO target for the rolling window, page.
Alert fatigue is the enemy. A probe that pages on every transient blip trains the team to ignore pages. Configure probes with sensible thresholds (1-2 minute sustained failures across multiple regions) and a clear runbook attached to the page.
The status page (status.yourcompany.com) is the user-facing output of availability monitoring. When probes detect an outage, the status page shows degraded. This is the contract with users: we'll tell you when something's broken.
A probe from one location can't distinguish a global outage from a regional network issue. Probe from at least 3 geographically distributed locations. If only one region fails, it's probably a network path issue affecting users in that region — investigate, but it's not a global outage. If all regions fail, the service is down. This also catches region-specific issues: a CDN misconfiguration in Europe, a misrouted DNS in Asia, a regional TLS problem.
Uptime is calculated as successful_probes / total_probes over a window. Subtleties:
- Probe frequency matters: a probe every 5 minutes can miss a 4-minute outage. Probe every 1 minute for critical paths.
- Window choice: a 30-day rolling window smooths blips but lags. A 24-hour window is responsive but noisy. Most teams report both.
- Downtime attribution: was it really downtime, or was it a probe failure? Probes can fail due to network issues between the probe and your service that aren't your service's fault. Investigate each outage.
- Planned maintenance: scheduled downtime is usually excluded from SLA calculations but still appears on the status page.
The SLA itself is a contractual version of uptime: "if we miss 99.95% in a month, you get 10% service credit." This makes availability real to the business — missing it costs money.
Your internal health checks all show green, but users are reporting they can't reach the service. What's the most likely failure mode that internal checks missed?
Pick one answer.
You set up an availability probe from a single location in us-east-1. It pages at 3am because the probe couldn't reach your service. What's wrong with this setup?
Pick one answer.
Engineering mental model
Mental model. Think of Availability Monitoring as a deliberate boundary in a system. The boundary exists because something becomes harder to manage when everything is done in one place: latency, scale, failure isolation, consistency, cost, or team ownership. The useful question is not “what does Availability Monitoring mean?” but “what pressure makes this boundary worth introducing, and what new failure mode does it create?”
Before choosing Availability Monitoring, name the workload, the critical user path, the dominant bottleneck, the failure you are trying to absorb, and the trade-off you are willing to accept. If you cannot name those five things, the design is probably premature.
// Pseudocode
request = receive()
result = availability_monitoring(request)
return result

// Production questions:
// 1. What happens on timeout?
// 2. Can this operation be retried safely?
// 3. What is the bottleneck?Back-of-the-envelope reasoning
Numerical lens: write down traffic, payload size, read/write ratio, peak multiplier and durability target before choosing a component. The numbers should justify the architecture.
Interactive sandbox: Availability Monitoring
Availability probing detects outages. Predict detection time for Availability Monitoring.
Change one variable at a time. Predict the failure mode first, then move the slider and see whether your mental model matches the simplified system response.
If you are stuck on Availability Monitoring, start by drawing the request path and marking every network hop, stateful component, queue, cache and failure boundary. Then estimate where the system will saturate.
You increase traffic by 10× in a system using Availability Monitoring. What should you inspect first?
Pick one answer.
Which statement is the safest engineering habit when using Availability Monitoring?
Pick one answer.
You have dashboards for traffic, latency, errors and saturation. You can change the architecture, but every change has operational cost.
Production scenario: your system uses Availability Monitoring, traffic suddenly spikes, and p99 latency doubles. What is your first move?
Interview drill
Answer this without notes: When would you choose Availability Monitoring, and when would you intentionally avoid it? Mention at least one bottleneck it addresses, one failure mode it introduces, and one alternative. Then quantify the workload you are designing for.
A useful engineering lens for Availability Monitoring: define the problem it solves, the simpler design that fails first, the constraint that forces you to introduce this concept, and the new failure modes the concept creates.
Numerical sanity check
Back-of-the-envelope reasoning beats fake precision. State your traffic, payload, concurrency and growth assumptions explicitly, then calculate enough to know whether the current architecture is orders of magnitude away from the target.
Do not optimize for a memorized definition. Reason from the workload and failure mode.
Imagine the simplest version of a system using Availability Monitoring. What breaks first as traffic grows by 10×, and what would you change before reaching 100×?
Pick one answer.
What you gain, what you pay
- +Catches external issues that internal health checks miss (DNS, TLS, routing).
- +Measures the actual user experience, not just container health.
- +Drives the SLA — availability is the user-visible metric.
- +Powers status pages, giving users transparency during incidents.
- −Probes can fail for reasons unrelated to your service (probe-side network issues).
- −Probe frequency limits detection — a 1-min probe can miss a 30s outage.
- −Alert fatigue if thresholds are too sensitive.
- −Doesn't tell you what's broken — only that something is. Needs correlated logs/traces.
How this breaks in production
- Single-region probe pages on every regional network blip.
- Probe frequency too low — misses short outages.
- Probe checks only the LB health endpoint, not user-visible paths.
- Alert fatigue from over-sensitive thresholds teaches teams to ignore pages.
Don't fall into these traps
- •Relying only on internal health checks (miss external path failures).
- •Probing from a single location.
- •Probing only the load balancer health endpoint, not user-visible URLs.
- •Not excluding planned maintenance from uptime calculations.
Real systems using this
How real systems implement this
- Pingdom — Synthetic probes from ~30 global locations checking user-visible URLs every 1-5 minutes. Pages on-call when multiple regions fail. Powers many public status pages.
- GitHub Status Page — Reports availability of major GitHub services based on synthetic checks. Degraded status is shown when probes detect issues, providing transparency to users.
Practice saying it out loud
- Q1What's the difference between internal health checks and availability monitoring?
- Q2Why probe from multiple geographic locations?
- Q3How do you avoid alert fatigue with availability probes?
- Q4How is uptime calculated, and what are its subtleties?
Further reading & references
Core explanations are original NO CAP material. External references are provided for deeper study and standards.
What next?
Mark as understood once the mental model clicks.
Next recommended
Health Monitoring